We're pleased to announce today the beta availability of Analytics for social media hubs—a comprehensive advanced reporting and analytic package for TwineSocial. This new feature significantly increases visibility into the engagement and performance of your social hubs. Here's a quick overview:
Analytics for Social Media Hubs: DashBoard
When you login to manage your TwineSocial account, you'll now see a new Analytics tab in the left navigation.
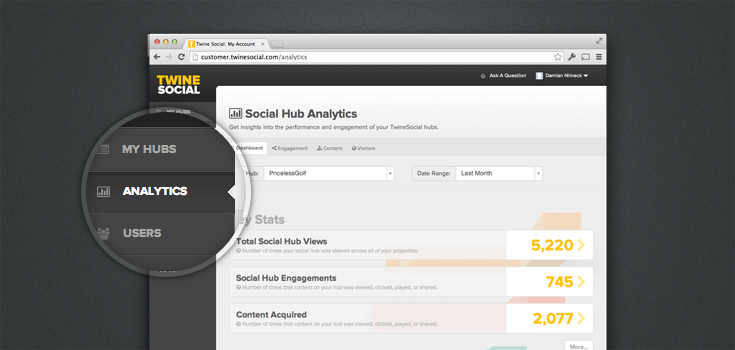
Choose your social hub and period to get quick stats on the number of hub views, engagements, volume of content acquired, popular actions, popular data sources and more.

Engagement
This section helps you understsand how users engage with your social hubs. You can easily drill down and answer questions like "how many times did people view videos on my social hub last week" and "how far down into my hub did users explore?"

Content
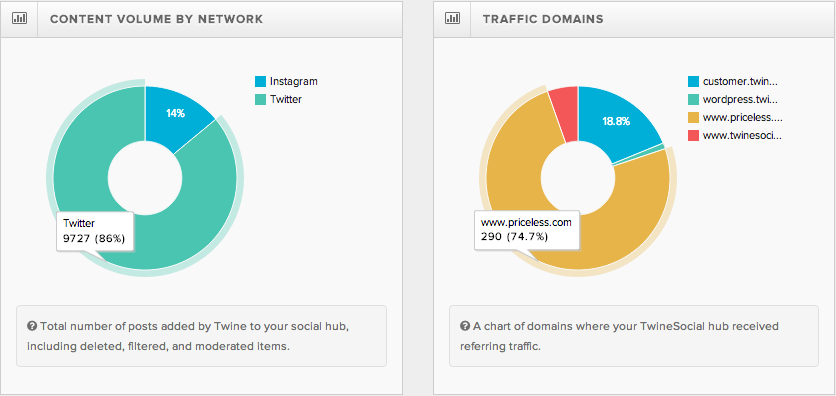
Content Analytics reports let you analyze the content ingested by TwineSocial into your hubs. This is an easy place to determine where your target content most frequently originates. In addition, if you embed your TwineSocial hubs on more than one media property, you'll be able to see which property drives the most volume.
Visitor Analytics
Visitor Analytics help you understand your visitor profile and your traffic sources. You'll quickly determine what your top referring domains and URLs are, the browser type and platform of your users, and geo-coded traffic patterns.

Analytics for Social Media Hubs from Twine is live and available today.
Check it out and give us your feedback!

